Kerala RTO Vehicle Registration Statistics 2026: Complete Rankings and Key Trends
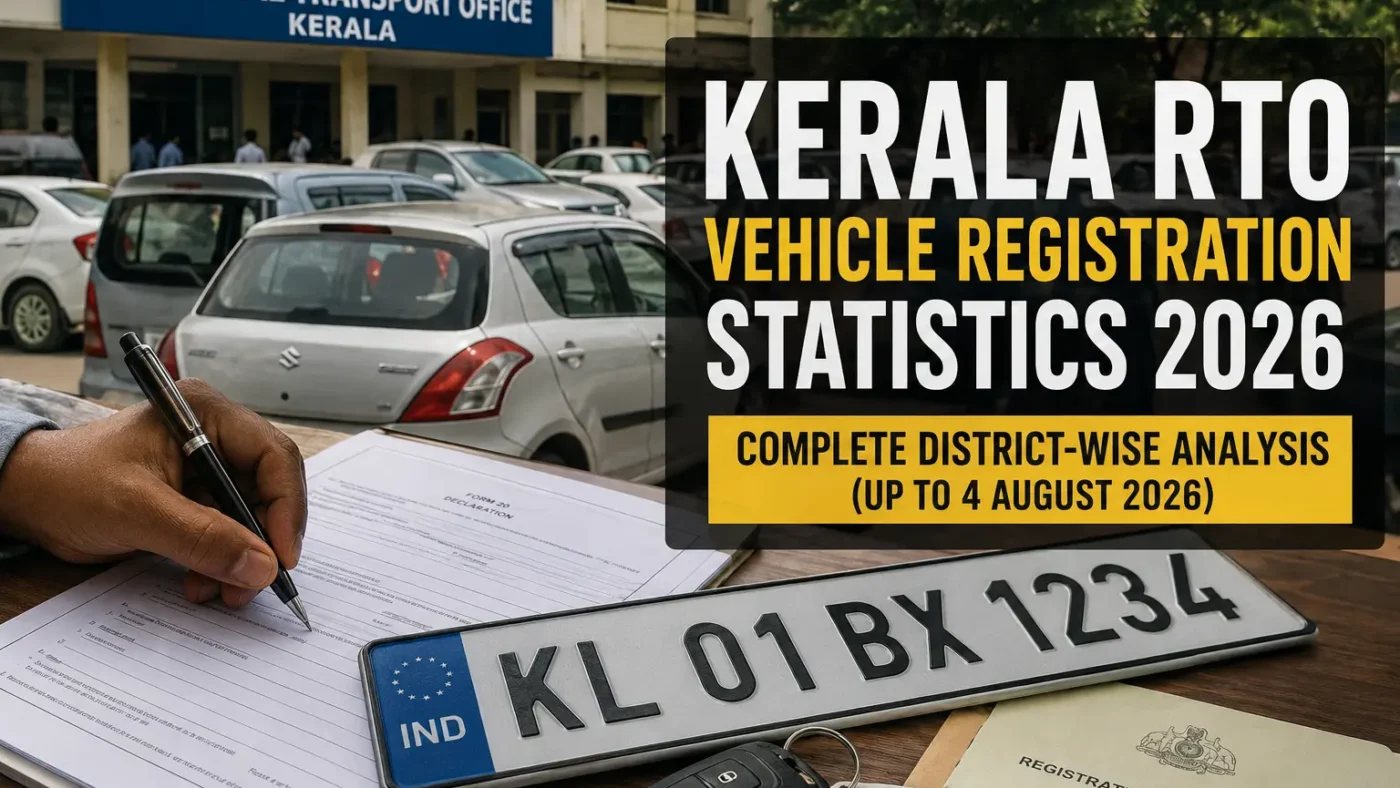
Vehicle registration data from Kerala for 2026 provides an interesting picture of where new vehicle registrations are concentrated across the state. Based on the available data up to 4 August 2026, registrations vary considerably between Kerala’s 85 RTO and Sub-RTO offices.
Thiruvananthapuram (KL-01) leads the state with 24,159 registrations, followed by Kollam and Ernakulam. Several RTO offices in northern Kerala, particularly in Malappuram, Kozhikode and Kannur regions, also record substantial registration volumes.
The figures are useful not merely as a ranking of RTO offices. They also provide a snapshot of vehicle demand, population distribution, urbanisation and the increasing dependence on private road transport across Kerala.
Top 20 Kerala RTOs by Vehicle Registrations in 2026
| Rank | RTO | Location | Registrations |
|---|---|---|---|
| 1 | KL-01 | Thiruvananthapuram | 24,159 |
| 2 | KL-02 | Kollam | 17,759 |
| 3 | KL-07 | Ernakulam | 17,179 |
| 4 | KL-55 | Tirur | 14,591 |
| 5 | KL-08 | Thrissur | 13,436 |
| 6 | KL-11 | Kozhikode | 13,425 |
| 7 | KL-13 | Kannur | 12,916 |
| 8 | KL-58 | Thalassery | 12,320 |
| 9 | KL-14 | Kasaragod | 12,163 |
| 10 | KL-65 | Tirurangadi | 11,889 |
| 11 | KL-57 | Koduvally | 11,322 |
| 12 | KL-05 | Kottayam | 11,311 |
| 13 | KL-18 | Vadakara | 10,657 |
| 14 | KL-21 | Nedumangad | 10,027 |
| 15 | KL-10 | Malappuram | 9,455 |
| 16 | KL-32 | Cherthala | 9,403 |
| 17 | KL-84 | Kondotty | 9,368 |
| 18 | KL-09 | Palakkad | 9,326 |
| 19 | KL-04 | Alappuzha | 9,282 |
| 20 | KL-39 | Thripunithura | 8,703 |
Thiruvananthapuram Tops Kerala
Thiruvananthapuram KL-01 is clearly the largest individual registration office in Kerala in the available 2026 data, recording 24,159 vehicles by 4 August.
This is approximately 6,400 registrations more than Kollam, which occupies second position with 17,759 registrations.
As Kerala’s capital and one of its largest urban regions, Thiruvananthapuram has a substantial population, government workforce, commercial activity and rapidly developing suburban belt. These factors can contribute to higher vehicle registrations. However, registration figures alone should not be treated as a direct measure of population, prosperity or actual vehicles operating within a particular RTO jurisdiction.
Kollam and Ernakulam Take Second and Third Positions
Kollam KL-02 recorded 17,759 registrations, while Ernakulam KL-07 recorded 17,179.
The relatively small difference between the two puts Kollam narrowly ahead of Ernakulam in this particular dataset.
Importantly, these figures relate to individual RTO offices rather than the total registrations of entire districts. Districts such as Ernakulam have several additional Sub-RTO jurisdictions including Aluva, North Paravur, Perumbavoor, Muvattupuzha, Angamaly, Kothamangalam, Mattancherry and Thripunithura. District-wise totals would therefore produce a very different ranking.
Tirur Emerges as a Major Vehicle Registration Centre
Perhaps one of the most interesting numbers in the list is Tirur KL-55.
With 14,591 registrations, Tirur ranks fourth across Kerala, ahead of major city RTOs including Thrissur, Kozhikode and Kannur.
The broader Malappuram region also performs strongly across several registration offices.
- Tirur: 14,591
- Tirurangadi: 11,889
- Malappuram: 9,455
- Kondotty: 9,368
- Perinthalmanna: 8,701
- Nilambur: 7,959
- Ponnani: 7,052
The numbers demonstrate the importance of looking beyond Kerala’s traditional metropolitan centres when analysing vehicle ownership and road transport demand.
Palakkad RTO Records 9,326 Registrations
Palakkad KL-09 recorded 9,326 registrations up to 4 August 2026, placing it 18th among the 85 offices listed in the dataset.
Other registration offices serving the wider Palakkad district recorded:
| RTO / Sub-RTO | Registrations |
|---|---|
| Palakkad KL-09 | 9,326 |
| Pattambi KL-52 | 8,578 |
| Ottapalam KL-51 | 6,408 |
| Alathur KL-49 | 5,466 |
| Mannarkkad KL-50 | 5,142 |
| Chittur KL-70 | 4,817 |
Combined analysis of these offices provides a much better indication of vehicle registration activity across Palakkad district than the KL-09 figure alone.
Kerala RTO Vehicle Registration Ranking 2026 – Complete List
| Rank | Code | RTO / Sub-RTO | Registrations |
|---|---|---|---|
| 1 | KL-01 | Thiruvananthapuram | 24,159 |
| 2 | KL-02 | Kollam | 17,759 |
| 3 | KL-07 | Ernakulam | 17,179 |
| 4 | KL-55 | Tirur | 14,591 |
| 5 | KL-08 | Thrissur | 13,436 |
| 6 | KL-11 | Kozhikode | 13,425 |
| 7 | KL-13 | Kannur | 12,916 |
| 8 | KL-58 | Thalassery | 12,320 |
| 9 | KL-14 | Kasaragod | 12,163 |
| 10 | KL-65 | Tirurangadi | 11,889 |
| 11 | KL-57 | Koduvally | 11,322 |
| 12 | KL-05 | Kottayam | 11,311 |
| 13 | KL-18 | Vadakara | 10,657 |
| 14 | KL-21 | Nedumangad | 10,027 |
| 15 | KL-10 | Malappuram | 9,455 |
| 16 | KL-32 | Cherthala | 9,403 |
| 17 | KL-84 | Kondotty | 9,368 |
| 18 | KL-09 | Palakkad | 9,326 |
| 19 | KL-04 | Alappuzha | 9,282 |
| 20 | KL-39 | Thripunithura | 8,703 |
| 21 | KL-53 | Perinthalmanna | 8,701 |
| 22 | KL-42 | North Paravur | 8,665 |
| 23 | KL-60 | Kanhangad | 8,588 |
| 24 | KL-52 | Pattambi | 8,578 |
| 25 | KL-29 | Kayamkulam | 8,577 |
| 26 | KL-59 | Taliparamba | 8,519 |
| 27 | KL-46 | Guruvayur | 8,481 |
| 28 | KL-23 | Karunagappalli | 8,456 |
| 29 | KL-85 | Ramanattukara (Feroke) | 8,369 |
| 30 | KL-48 | Wadakkanchery | 8,101 |
| 31 | KL-41 | Aluva | 8,002 |
| 32 | KL-71 | Nilambur | 7,959 |
| 33 | KL-76 | Nanmanda | 7,946 |
| 34 | KL-45 | Irinjalakuda | 7,851 |
| 35 | KL-22 | Kazhakkoottam | 7,836 |
| 36 | KL-17 | Muvattupuzha | 7,707 |
| 37 | KL-16 | Attingal | 7,584 |
| 38 | KL-40 | Perumbavoor | 7,407 |
| 39 | KL-74 | Kattakkada | 7,091 |
| 40 | KL-54 | Ponnani | 7,052 |
| 41 | KL-43 | Mattancherry | 6,906 |
| 42 | KL-31 | Mavelikkara | 6,852 |
| 43 | KL-33 | Changanassery | 6,574 |
| 44 | KL-19 | Parassala | 6,510 |
| 45 | KL-03 | Pathanamthitta | 6,510 |
| 46 | KL-56 | Koyilandy | 6,475 |
| 47 | KL-51 | Ottapalam | 6,408 |
| 48 | KL-20 | Neyyattinkara | 6,365 |
| 49 | KL-64 | Chalakudy | 6,337 |
| 50 | KL-75 | Thriprayar | 6,138 |
| 51 | KL-86 | Payyannur | 6,036 |
| 52 | KL-77 | Perambra | 5,922 |
| 53 | KL-24 | Kottarakkara | 5,721 |
| 54 | KL-49 | Alathur | 5,466 |
| 55 | KL-50 | Mannarkkad | 5,142 |
| 56 | KL-47 | Kodungalloor | 5,103 |
| 57 | KL-38 | Thodupuzha | 4,931 |
| 58 | KL-78 | Iritty | 4,919 |
| 59 | KL-26 | Adoor | 4,896 |
| 60 | KL-70 | Chittur | 4,817 |
| 61 | KL-81 | Varkala | 4,757 |
| 62 | KL-35 | Pala | 4,584 |
| 63 | KL-63 | Angamaly | 4,584 |
| 64 | KL-27 | Thiruvalla | 4,488 |
| 65 | KL-36 | Vaikom | 4,345 |
| 66 | KL-73 | Sulthan Bathery | 4,330 |
| 67 | KL-12 | Wayanad | 4,322 |
| 68 | KL-25 | Punalur | 4,239 |
| 69 | KL-44 | Kothamangalam | 4,117 |
| 70 | KL-34 | Kanjirappally | 4,093 |
| 71 | KL-30 | Chengannur | 4,055 |
| 72 | KL-72 | Mananthavady | 3,851 |
| 73 | KL-69 | Udumbanchola | 3,673 |
| 74 | KL-61 | Kunnathur | 3,643 |
| 75 | KL-82 | Chadayamangalam | 3,336 |
| 76 | KL-83 | Konni | 3,126 |
| 77 | KL-66 | Kuttanad | 2,913 |
| 78 | KL-80 | Pathanapuram | 2,689 |
| 79 | KL-06 | Idukki | 2,686 |
| 80 | KL-37 | Vandiperiyar | 2,656 |
| 81 | KL-62 | Ranni | 2,637 |
| 82 | KL-67 | Uzhavoor | 2,578 |
| 83 | KL-28 | Mallappally | 2,569 |
| 84 | KL-79 | Vellarikkundu | 2,545 |
| 85 | KL-68 | Devikulam | 2,183 |
Which RTOs Recorded the Lowest Registrations?
The five lowest figures in the dataset are:
- Devikulam KL-68: 2,183
- Vellarikkundu KL-79: 2,545
- Mallappally KL-28: 2,569
- Uzhavoor KL-67: 2,578
- Ranni KL-62: 2,637
Several of these offices cover comparatively smaller, rural or mountainous populations. Geography, population density, economic activity, public transport availability and administrative boundaries can all influence registration volumes.
What Do Vehicle Registration Numbers Actually Tell Us?
High registration numbers can indicate strong demand for automobiles, but they should be interpreted carefully.
An RTO with more registrations does not automatically mean that its residents own more vehicles per person. Registration jurisdiction boundaries vary significantly. Some offices serve densely populated urban and suburban areas, while others cover relatively small populations.
A more meaningful transport analysis would combine registration figures with:
- Population of each RTO jurisdiction
- Registrations per 1,000 residents
- Vehicle category – cars, motorcycles, goods vehicles, taxis and buses
- Electric vehicle registrations
- Road length and road capacity
- Public transport availability
- Traffic congestion and accident statistics
- Year-on-year registration growth
More Vehicles Also Mean Greater Infrastructure Pressure
Kerala already has one of India’s most road-dependent settlement patterns. Continued growth in private vehicle ownership creates additional pressure on roads, junctions, parking facilities and urban spaces.
The solution cannot simply be to keep widening roads indefinitely. Kerala also needs safer pedestrian infrastructure, better buses, improved railway connectivity, effective parking management, cycling infrastructure and better integration between different modes of transport.
Vehicle registration growth should therefore be considered not merely an automobile market statistic, but an important input for transport and urban planning.
Key Takeaways from Kerala’s 2026 Vehicle Registration Data
- Thiruvananthapuram KL-01 ranks first with 24,159 registrations.
- Kollam KL-02 ranks second with 17,759.
- Ernakulam KL-07 is third with 17,179.
- Tirur KL-55 is a notable fourth with 14,591 registrations.
- Several RTOs in northern Kerala show particularly strong registration volumes.
- Palakkad KL-09 ranks 18th with 9,326 registrations.
- Devikulam KL-68 records the lowest total in this dataset with 2,183.
- Individual RTO rankings should not be confused with district-wise vehicle registration rankings.
The Bigger Question: Can Kerala’s Roads Keep Up?
The continuing increase in vehicle ownership raises a bigger question for Kerala: Can the state’s transport infrastructure keep pace with the number of vehicles being added to its roads?
More registrations mean greater mobility for individuals, but they can also mean more congestion, parking demand, emissions and road-safety challenges unless transport infrastructure and public transport improve alongside vehicle ownership.
Kerala’s future transport strategy therefore needs to look beyond the number of vehicles sold and registered. The real objective should be to move people safely, efficiently and sustainably.
Data note: The figures presented here are based on the Kerala RTO vehicle registration dataset supplied for the period up to 4 August 2026. Registration figures are cumulative for the stated period and may subsequently change as newer data becomes available. Readers seeking official or updated figures should verify them with the Kerala Motor Vehicles Department or the VAHAN database.
Roads & Rails tracks road, railway and public transport developments with a focus on infrastructure, safety, accessibility and civic awareness.
Visit RoadsandRails.org for more transport news, data and analysis.